Modeling, machine learning and physics, oh my!
Earlier this month, members of our Data Science and Product Management teams participated in the Utility Analytics Summit, an annual event to learn “how utilities are using data and analytics to transform the industry, drive innovation and navigate disruption.” A highlight of the event was the Lightning Talks (8-minute presentations that focus on a single topic, concept or idea).
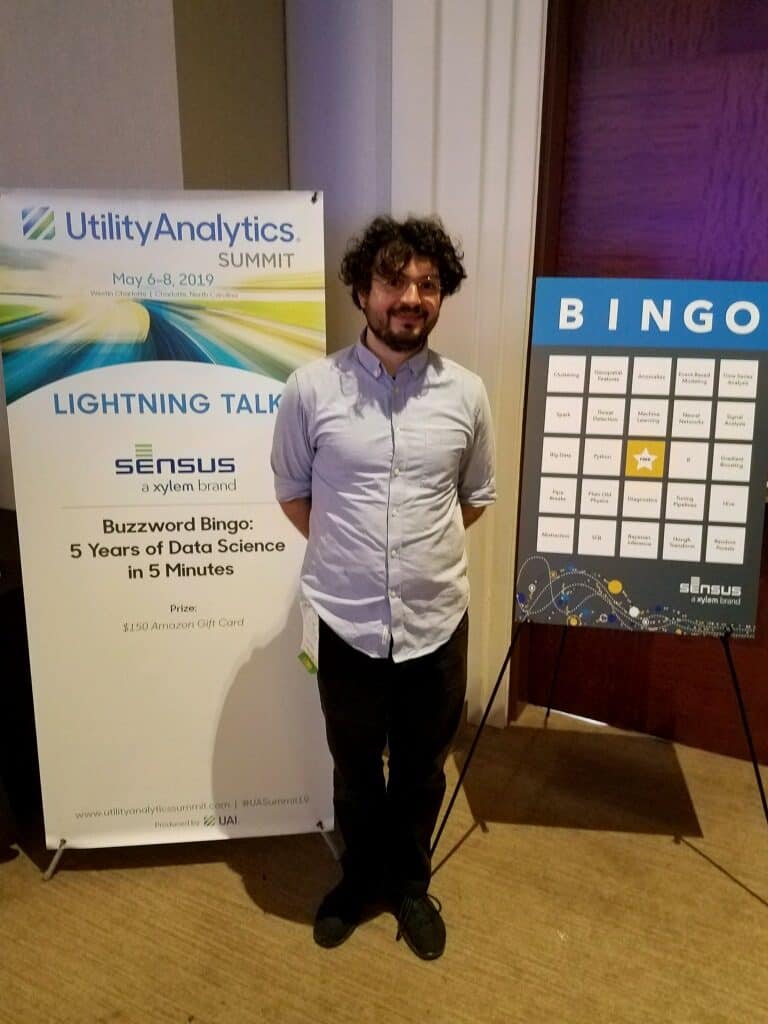
Buzzword Bingo

Vincent Toups, one of our Data Engineers, who also happens to be experienced in the art of spreading, delivered a fun Lightning Talk. “Spreading?” you might ask? Like peanut butter? No, spreading is the act of speaking extremely fast during a competitive debate. (And Vincent did speak extremely fast!) Attendees had to listen carefully to the “buzzwords” in his talk and mark them off on their bingo cards to hopefully win a prize.
Vincent was willing to share a transcript of his speech. For those of you who were lucky enough to hear it in person, I’m sure you’ll enjoy taking in the content in a more digestible manner and without the pressure of winning a bingo prize. And for those who couldn’t attend the event, this is a perfect introduction to learning about the Xylem and Sensus advanced data science team and how they are continually working to improve our industry.
Full disclosure: I lightly edited the transcript to make it more readable in this format and added hyperlinks to provide more information. Words in ALL CAPS were left as is so the reader can experience Vincent’s exuberant presentation style through his accentuation.
The Speech: Five Years of Data Science in Five Minutes
(If you want the spreading effect, read this as fast as possible.)
Dr. Vincent Toups, Data Engineer and Lightning Talk Presenter Extraordinaire
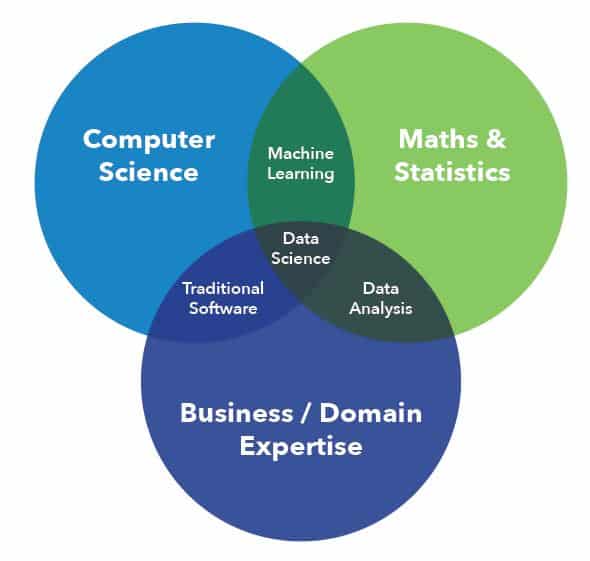
Hello everyone I’m Dr. Vincent Toups and this is everything my five person data science team has done in our four year history! We’re an INTERDISCIPLINARY team consisting of three mathematicians, two PHYSICISTS, one and a half STATISTICIANS, a BUSINESS GUY and a MACHINE LEARNING expert and about three and a half SOFTWARE ENGINEERS. That sounds like 12 people but we squeezed it down into five very busy folks.
We started as an adjunct to Sensus’ BIG DATA initiative. Sensus is an internet-of-things company which specializes in the development, manufacturing, deployment, and maintenance of water, gas and electric smart meters (plus smart lighting end points).
We’ve got millions of meters out there sending dozens of messages a day – we’re like the TWITTER of metering except we aren’t destroying civilization!
Our data science team used HADOOP, HIVE, and SPARK and to do FAILURE MODE ANALYSIS on over four million meters used BAYESIAN INFERENCE to automatically identify discrepancies between configurations in the data lake and in the field. We did large scale, high performance geospatial and temporal visualization of meter time series data too!
Do we know webgl? YES!
Can we write shaders? You bet!
Did we do computations on the GPU from INSIDE THE BROWSER!? YES WE DID!
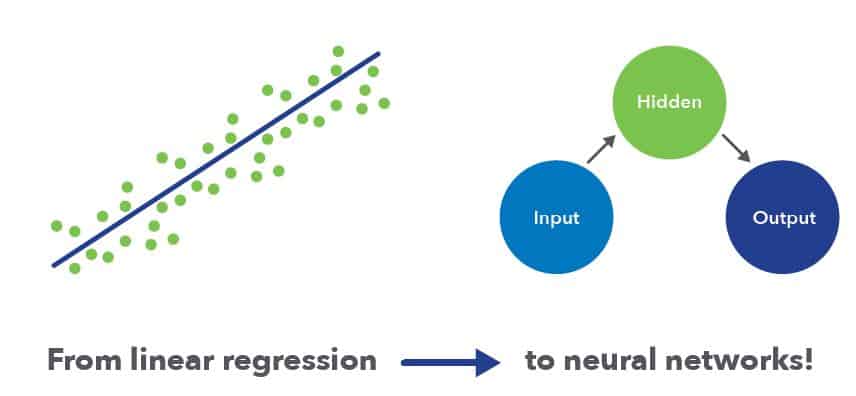
We also applied various classifiers, from linear regressions to neural networks, to an RF SIGNAL ANALYSIS problem to predict bandwidth from meters, using GEOSPATIAL FEATURES.
We aggregated MILLIONS of messages of YEARS of operation to estimate TWO WAY COMMUNICATION between our towers and our meters. The problem goes like this! If you’ve got a meter at GIS coordinate, and you have years of history can you predict by looking at mostly ONE WAY messages whether a TWO WAY meter will work with 100% efficiency if you put it at the same location? Turns out you can’t. (Can’t win ‘em all!) In order to do this we had to calculate optimal post-hoc calibrations of thousands of RF towers using years of data!
We performed EVENT BASED and DIFFUSION MODELING to simulate PEER TO PEER firmware upgrades and to optimize the initial installation sites.
Can we write sophisticated simulations of the progress of firmware upgrades through a simulated network? YES!
Can we do rad visualizations? YES.
Can we use Tensorflow to treat the problem as a network diffusion problem? HECK YES!
When Sensus was acquired by Xylem, the scope of our work increased dramatically to cover all sorts of water related tasks. Xylem is an international company totally obsessed with water but in a very good way! We build pumps, sensors, meters, robots, drones, and a forest of software to solve water problems!
Want to predict storm water flows so you can optimize your drainage systems? WE’RE working on it!
Simulate the hydraulics of an entire water network from tanks to meters so you can detect leaks and reclaim non-revenue water? Working on it!
Want robots that can crawl through miles of pipes using sonar to detect problems before they happen? Xylem has it!
We used time series analysis techniques like SARIMA models to figure out when WATER PUMPS will run out of gas or need re-servicing. It turns out its real bad if a pump runs out of gas, so most people are very conservative about refueling them while they do important jobs like prevent flooding during storms. Because we can use time series analytics to predict with high accuracy whether and when a refueling needs to take place, these conservative schedules can be relaxed without risk of running out of gas!
We used VARIATIONAL AUTOENCODERS to do THREAT DETECTION on UTILITY NETWORKS. A variational auto-encoder can take the total activity of an entire electric network and find a simple representation from which we can extract a simple probability of observing that network state. If that probability gets too small, such a network can let you know that things look unusual. All this happens WITHOUT ANY ASSUMPTIONS about network activity!
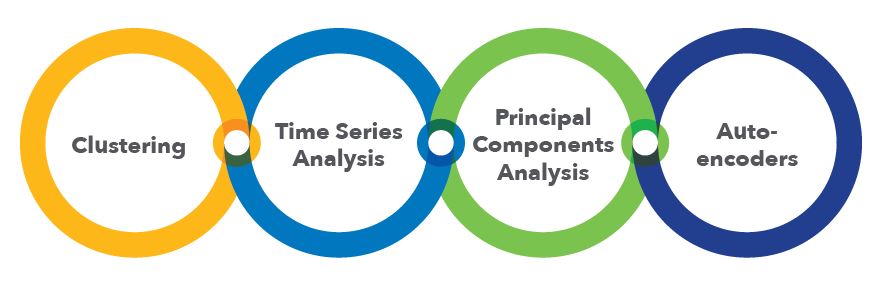
We’ve used automated clustering, PCA and normal AUTOENCODERS to examine time series data to detect large events at utilities. You can think of a week of read data as a vector in a high dimensional vector space. But since we expect reads to represent human activity, which is fairly simple, we can use an autoencoder or PCA or another kind of dimensionality reduction method to project these complicated time series data in simple categories or colors and from that data see things that would be invisible without pre-processing.
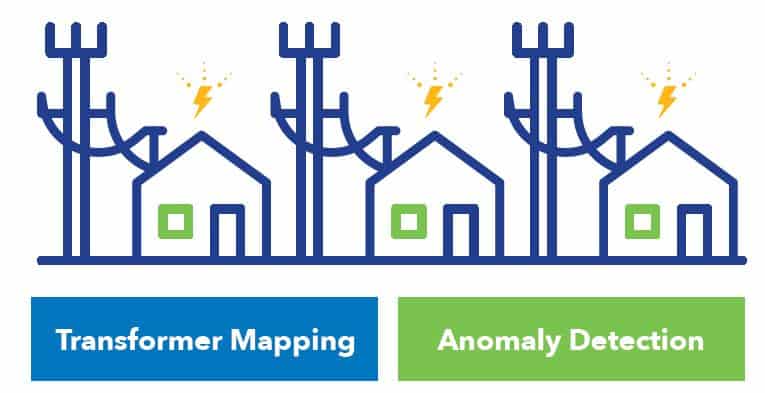
We used linear regression and PLAIN OLD PHYSICS to automate the mapping of households to TRANSFORMERS in electric networks! Most electric utilities maintain lists of which meters/households are connected to which transformers, but especially after large events like major storms this mapping can get out of date. But because voltage variations should be correlated between meters on the same transformer, we can take our history of electric read data and automatically correct or totally infer a transformer mapping for a utility.
We’ve worked with MIT data scientists on building and AUTOMATICALLY TUNING data science pipelines using BAYESIAN BANDITS. How does that work, you might be asking? First a machine learning pipeline is representing in a standardized format which reifies the split between data, models, and hyper-parameters. Once models are so-described they can be passed to an automated system which solves the Bayesian Bandit problem on the family of possible models. This is a formal approach which tries to find the best model without wasting a lot of time running over the data one bad models. The MIT code is on github, check it out!
It’s really bad when pipes break!
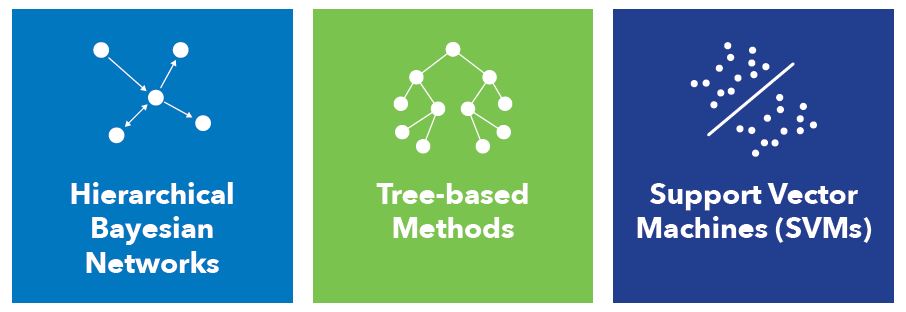
We’ve fit every model under the sun to try and predict when PIPE BREAKS will occur. We have hierarchical Bayesian networks fit using MARKOV CHAIN MONTE-CARLO in JAGS. We also fit SVMS and RANDOMFORESTS with GRADIENT BOOSTING!
Indeed, modeling pipe breaks is just the pilot project for a far reaching NETWORK INFRASTRUCTURE ANALYSIS project which will be all about modeling time series (especially COUNT PROCESSES like FAILURES or READS) on NETWORKS – in other words, many kinds of problems are autoregressive in space and in time and for utility networks in particular, the spatial components as represented on the physical network of say WIRES or PIPES may be more important than the 2d space of geospatial coordinates!
For instance, our data lake includes millions of electric reads along with alarm data and so-called “blink counts” caused by things like trees striking the power lines. Using exactly the same infrastructure analytics we can score wires by break probability. We can also use our consumption and voltage data to diagnose problems with transformers before they happen.
The deepest sort of count process of all (for electrical data) is consumption itself: since usage is just an aggregation of different, mostly binary on/off states during each hour, we’re investigating whether we can disaggregate consumption data into different usage categories – data which can be used to guide consumers towards more economical or environmentally friendly activity.
And speaking of electrical data, by looking at aggregate usage patterns in customers with load control modules, we’re able to diagnose which customers are benefiting most from those devices and even customers who might be cheating. This is just the simplest of the tampering analytics we can get up to with our city-spanning electrical data sets.
We’re eager to expand this expertise to problems on water, electric, gas and even sensor networks of arbitrary type. Look for open source libraries in the future.
AND THAT’S NOT ALL!
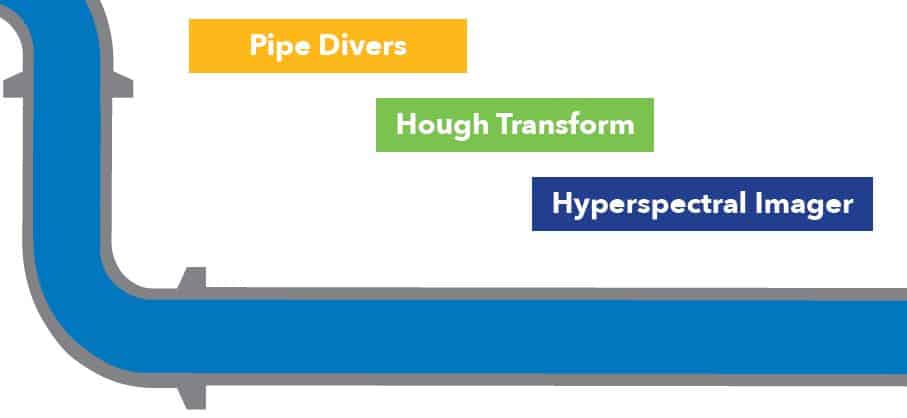
We’ve got data scientists using Hough Transforms to interpret SONAR DATA from PIPE DIVING ROBOTS in order to detect pipe corrosion both INSIDE and OUTSIDE the pipe! How does this work? A robot called a PIG SQUEEEEELS its way through a pipe making little chirps that bounce off of the pipe wall. They also bounce from the inner to outer surface of the pipe wall and from the arrival times of these echoes a 360 degree estimate of the pipe thickness can be calculated.
But what is the best way to decide when you hear the echoes? A Hough Transform treats each echo as evidence of what the true width is. By moving these transforms onto GPU’s we can perform them as FAST AS THE DATA COMES IN.
We used GUASSIAN PROCESS MODELS and plain old LINEAR REGRESSION to interpolate ALGAE sensors in the GREAT LAKES. To do it we had to fetch and do a GEOSPATIAL JOIN of HYPERSPECTRAL SATELLITE DATA. You want to know where algae is, even if you don’t have a sensor data there? We used spectral satellite data sensitive to the presence of blue-green algae and local sensor data to calibrate an algae predictor for locations where there isn’t a sensor.
We’ve written DATA PIPELINES to JOIN UP HYPERSPECTRAL IMAGING DATA from an AUTOMATED DRONE and to compare it to sensor data taken on the ground.
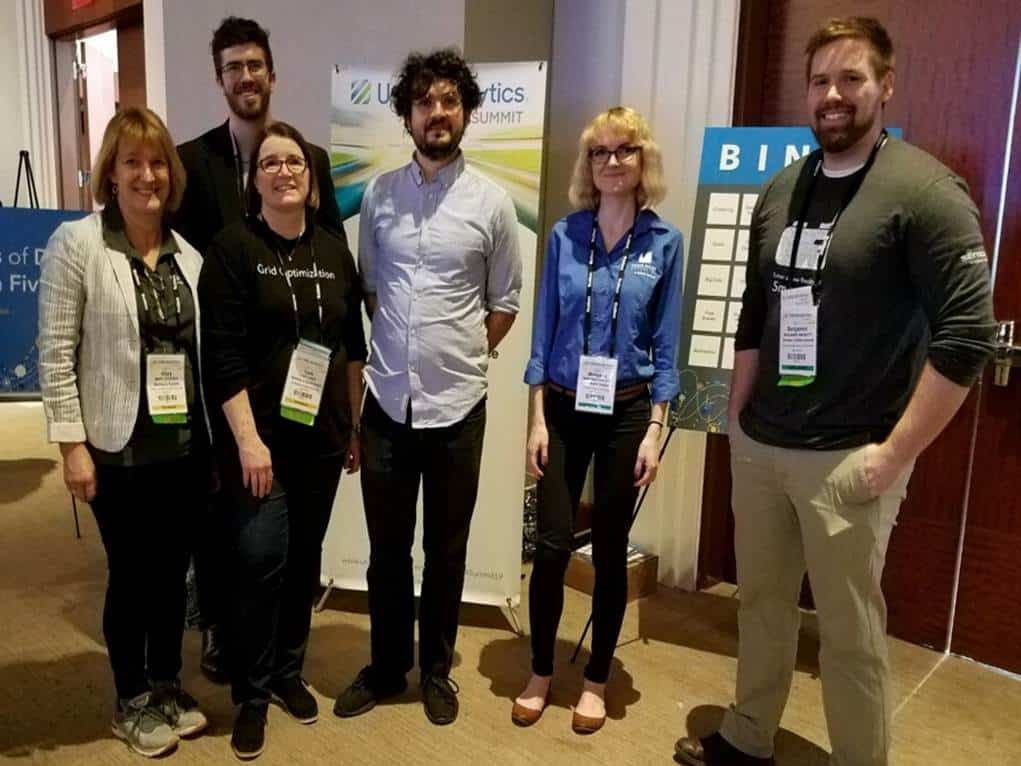
Team Xylem at Utility Analytics Week – From left to right, Mary Tulenko,
Jared Gregory, Toni Corey, Vincent Toups, Maryana Pinchuck, Ben Inkrott
And last but most importantly, we believe in DATA OPS and TRACEABILITY – we DOCKERIZE everything to make sure our analysis RUNS ANYWHERE, CONSISTENTLY. We’re GIT WIZARDS who use granular commits and automation to make our data science both RELIABLE and FULLY TRACEABLE. Want to know why our model looked different 6 months ago? WE CAN TELL YOU!
Xylem data science has done tons of stuff and we aren’t showing any signs of stopping!
Wow! That was a lot to take in.
Now take a deep breath and return to your normal reading pace. As you can see we have some very passionate people working on really exciting opportunities. While most think of Sensus as a smart meter company or AMI network provider, we also want you to know us as industry innovators, using utility data analytics to solve complex problems.