We are witnessing a great digital transformation! Data is the most powerful asset of the digital world. Smart meters, a good example of digital transformation, are devices that generate actionable data around the resource’s utilities manage.
In addition to data, there is something we are all attempting to get more of – time. One of Steve Jobs’ most famous quotes was, “the most precious resource we all have is time.”
The merging of data and time is referred to as a ‘time series’. More specifically, a time series is defined as a series of data points listed in time order.
We can observe everything around us using time series. For instance, the health of one’s heart while reading this sentence, could be described using a time series.
But, storing data doesn’t come cheaply, so how do you get a good return on investing in storing time-series data? The key is to find out what’s actionable. For example, you might look at a time series to identify when the data being measured is acting differently than normal.
In other words, when are anomalies occurring? But first, what is an anomaly?
In time-series data, an anomaly is defined as the data point that is significantly different from the rest of our data. While some data points are not significantly different from others, there still might be abnormal behavior in the subsequent series of data. At this point, subsequent pattern analysis helps us detect the anomaly.
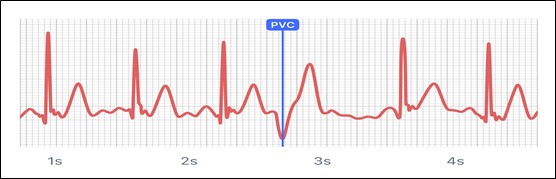
Let’s assume that while reading this page, your heartbeat pattern changed, but you didn’t feel any pain or difference in your mood. If you can’t feel it or see it, how would it be identified that your heartbeat changed, if it was something you need to be warned of? The answer is to visit a health professional who could analyze the time series of your heartbeats to determine if a pattern change exists that might be a sign of vital cardiac issues (see Figure 1).
Smart meters make up “the heart” of each house when it comes to water, gas and electric resources flowing into each home and business. Just like a medical professional uses time-series data in the form of heartbeats to determine human health, utilities could analyze time-series data in the form of consumption data to determine the health of utility networks.
Today, most utilities perform time series analysis by looking at defined threshold levels (i.e., if the number of kWhs or gallons is less than or greater than a certain amount) and applying simple business rules.
What if we could program computers using Artificial Intelligence (AI) to supplement existing threshold-based methodologies? What if AI could recognize if anomalies occur in time series consumption data by self-learning, similar to how a human does visually, to identify changes in consumption patterns? Then, what if these self-learnings could scale up to a network involving millions of smart meters to figure out when anomalies between different devices are related and what network issues are occurring?
Sound futuristic? Sound like an opportunity for a utility to realize greater efficiencies to improve their bottom line and drive down waste?
Sensus’ Data Science team is working to develop AI techniques today that could serve as the foundation for building this futuristic vision. By using highly accurate, robust data from Sensus devices, our team has demonstrated promising results using AI to analyze time-series consumption data. Examples of potential AI applications include:
- Discovering usage patterns from groups of consumers
- Discovering the most frequent patterns in consumption time series
- Identifying trends and seasonality in resource usage (i.e., electricity, water, gas)
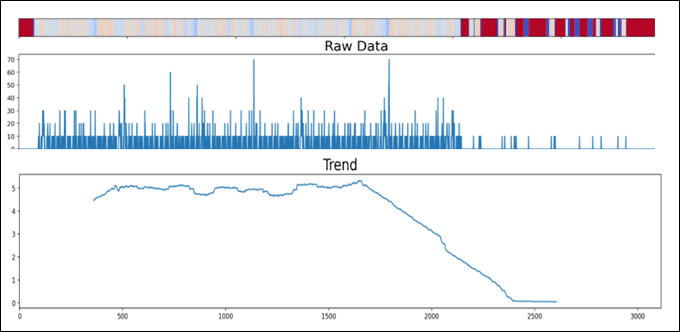
- Detecting anomalies (see Figure 2, where the red/dark blue lines above raw data is AI learned anomaly detection)
- Predicting usage trends with AI tools (see Figure 2, where the trend chart is a trending prediction associated with a water pipe that was stopped up feeding a meter)
By leveraging AI tools to train a computer to identify the actionable changes in time series data, utilities could recognize greater efficiencies and more granular insights than using a threshold-based model alone.
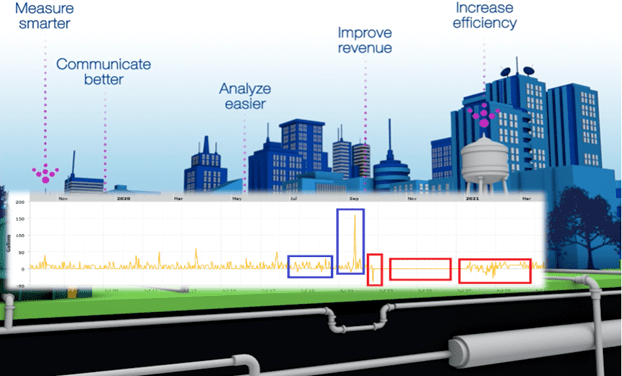
As you can see from figure 2, the chart of smart meter time series data, AI tools can be used to provide another dimension in managing utility resources. We believe using AI tools will give lots of useful insights that can contribute to the vision of Sensus’ products: measure smarter, communicate better, analyze easier, improve revenue and increase efficiency.
If you are interested in learning the “art of the possible” by applying AI to smart meter time series data, reach out to either of us (Brandon O’Daniel, Kagan Ilter)! We’d love to have a discussion to gauge interest.
By analyzing data across time, it helps you get your time back!